
m8shift-top dashboard reference
m8shift-top.py is M8Shift's read-only terminal dashboard. It turns the core status --json snapshot into a live overview without claiming the pen, changing relay state, or routing work. From an initialized project root, run:
python3 m8shift-top.pyThe dashboard refreshes every two seconds by default. Use --interval SECONDS to change that cadence and --utc to render every timestamp in UTC with a Z suffix.
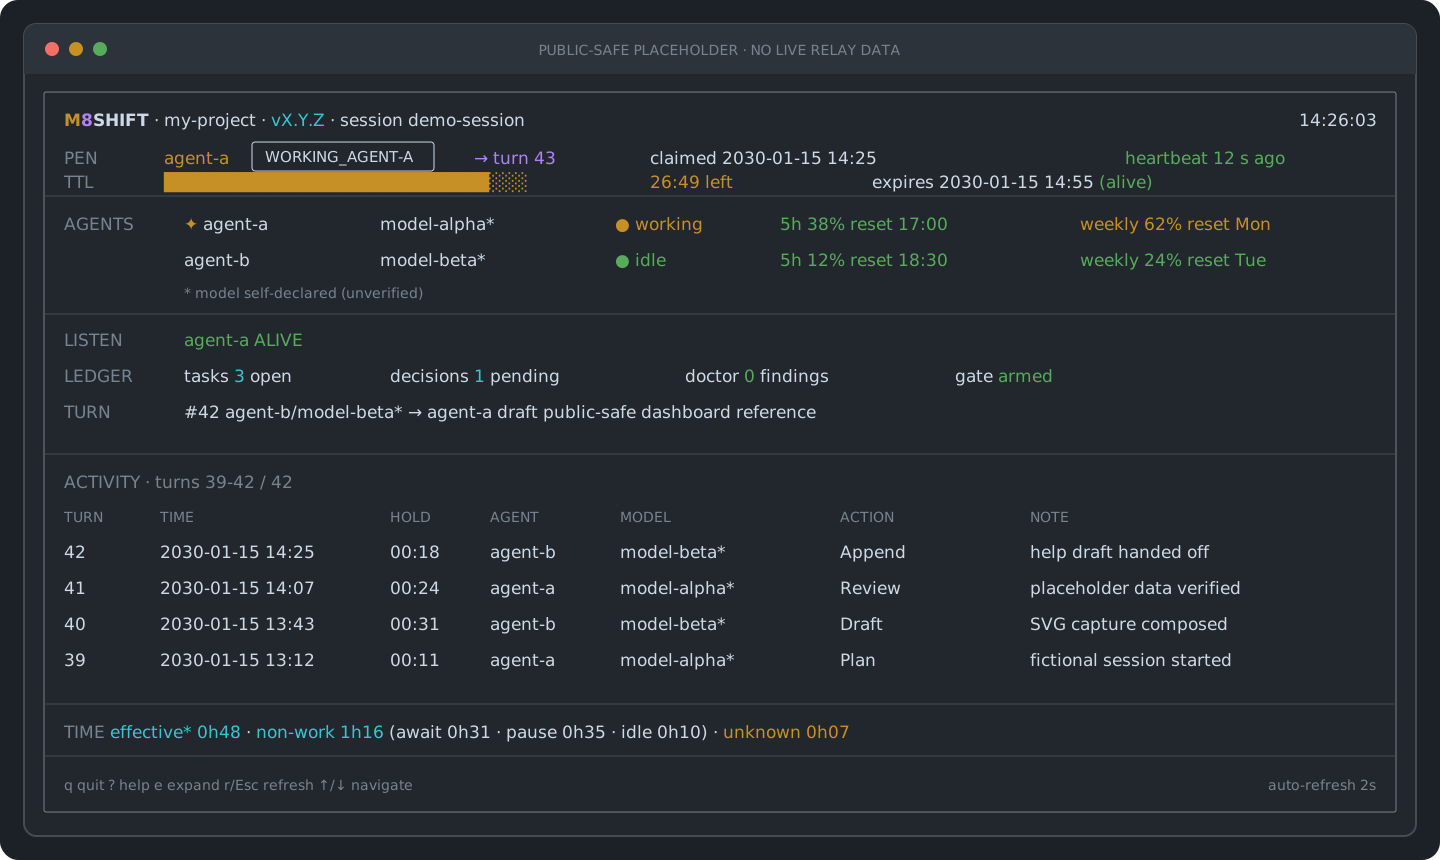
Public-safe capture: the illustration is a self-contained SVG facsimile, not a live screenshot. Every value is fabricated (
my-project,agent-a/agent-b,vX.Y.Z,demo-session, and fictional 2030 turns and timestamps). The SVG contains no external asset, project path, or live relay data. Keeping the capture as text also makes placeholder-data review and future updates reproducible in Git.
Frame and header
The box-drawing frame separates one refresh from ordinary terminal output. In an interactive terminal it occupies the alternate screen, uses the real terminal width and height, and restores the previous screen when it exits.
The header identifies the data being viewed:
- M8SHIFT is the dashboard wordmark.
- Project is the initialized project name, so an operator can distinguish terminals before acting elsewhere.
- Version is the
m8shift.pyengine version that produced the snapshot, not a dashboard-only release number. - Session is the immutable identifier of the current relay session.
- Clock is the render time. It uses the local timezone by default and UTC when invoked with
--utc.
The frame is structural, not decorative: after ANSI colour codes are removed, every line remains exactly the selected terminal width.
PEN and TTL
The two rows share fixed columns, so their related values line up at narrow and wide sizes.
PEN
The PEN row describes relay ownership:
- Agent is the current holder or awaited agent.
- State badge is the literal relay state, such as
[WORKING_AGENT-A]. Brackets and text preserve the meaning without colour. - Turn is the holder's live or next turn while the relay is working or awaiting. In states with no live turn, the dashboard labels the last turn instead; it never attributes a completed turn to a new holder.
- Claimed is when the current state window began.
- Heartbeat is the matching holder heartbeat expressed as an age such as
12 s ago, growing through minutes and hours. A missing heartbeat is—. Green means fresh, yellow means alive past the lease boundary, and red means ordinarily stale. The age remains the primary evidence; colour only reinforces it.
TTL
The TTL row describes the 30-minute pen lease:
- Gauge is the remaining share of the lease. Filled and empty cells make the trend visible in monochrome.
- Time left is the remaining lease as
MM:SS, clamped to zero after expiry. - Expires is the lease deadline in the selected display timezone.
- Alive / stale is the deadline comparison shown as text and colour. Green
alivemeans time remains; redstalemeans the deadline has passed.
TTL expiry and heartbeat liveness are related but not interchangeable. An alive-expired holder can have an expired lease and a fresh protective heartbeat; operators must follow the core stale-recovery rules rather than infer takeover permission from the gauge alone.
AGENTS
There is one AGENTS row per relay member:
✦marks the current pen holder.- The agent identifier is followed by an optional self-declared model. A trailing
*means the model label is unverified; the note below the rows repeats that boundary. - The dot and adjacent word show the role state. Green
idle, yellowworking, and a dim unknown state remain readable as words without colour. - 5h and weekly are provider usage windows. A percentage below 60% is green, 60% to below 85% is yellow, and 85% or more is red. If the provider supplies a reset instant, it appears beside the percentage.
n/ameans the provider structurally did not supply that window;unavailablemeans the reading could not be obtained.EXHAUSTED [model]is explicit when a window reaches 100% and a model is known.
Usage is advisory. It does not change claimability, relay state, or the pen.
LISTEN
LISTEN summarizes roster-owned listener sidecars:
agent-a ALIVEmeans the compact status snapshot found that resident listener's PID alive.nonemeans no live listener was found.unavailablemeans the snapshot value itself could not be read.
Do not read wake-ready as ALIVE. A foreground waiter can be wake-ready in the limited sense that it detected the next turn, but it cannot invoke a new agent run. The compact dashboard currently promotes only live listener PIDs; confirm the invocation backend with python3 m8shift-runtime.py listener status --agent AGENT before describing a setup as autonomous.
LEDGER and TURN
LEDGER projects four bounded operational counts:
- tasks N open counts open entries in the task event log;
- decisions N pending counts decision records whose status is proposed, pending, or draft;
- doctor N findings reports the local kit diagnostic count; zero is green and one or more is red;
- gate armed / disarmed says whether a valid usage-budget configuration is present. Armed is green and disarmed is yellow. The gate is advisory and does not replace the core pen rules.
Unknown values are rendered as unavailable instead of being guessed. Task and decision counts use cyan as information, not as a good/bad verdict.
TURN summarizes the most recently completed turn: immutable turn number, author, optional self-declared model, recipient, and a bounded excerpt of its ask. In the wide layout the label is TURN; the stacked layout spells it LAST TURN.
ACTIVITY and the expanded reader
ACTIVITY is a newest-first, bounded view of recent completed turns. Its heading uses real immutable turn numbers, for example turns 39-42 / 42, rather than buffer indices.
The compact wide table shows turn, timestamp, approximate hold duration, agent, self-declared model, action, and note. The stacked layout keeps the essential turn, agent/model, and summary. At most 20 events are visible. The dashboard asks core status for the viewport plus bounded scroll headroom, capped at 200 events; it does not reread the archive on every refresh. At the oldest edge of a truncated buffer, <older turns on disk — peek/journal> says explicitly that deeper history remains elsewhere.
Press e on a compact row to open the expanded reader. It fetches exactly that immutable turn with the read-only turn NUMBER --json surface, sanitizes terminal control characters, and word-wraps the complete done text without truncating it. Automatic refreshes reuse the fetched record. Up/down selects the newer/older turn block; left/right pages through text that is taller than the activity zone. Press e again to return to compact mode.
TIME
The permanent TIME strip accounts for the whole current session rather than one activity row:
- effective* is time in
WORKING_*. The asterisk matters: this is an exclusive WORKING-state proxy, not a measurement of productivity, CPU use, or result quality. - non-work is time in
AWAITING_*,PAUSED, andIDLE. When space allows, the strip shows those three components. - unknown is unclassified wall time whose transition evidence is missing, malformed, unsupported, or ambiguous. It is always retained when accounting is partial.
The accounting invariant is wall = effective + non-work + unknown. Coverage is (wall - unknown) / wall. An exact record has 100% coverage and omits unknown; a partial record keeps unknown visible, and its classified totals cover only the evidenced intervals. The detailed quality, coverage percentage, and diagnostics remain available through m8shift.py status and m8shift.py time even when terminal width forces the top strip to abbreviate.
TIME colours are deliberately non-judgmental: effective and non-work are informational cyan, while unknown is yellow because it marks incomplete evidence rather than a relay failure.
Keyboard reference
| Key | Compact dashboard | Expanded activity |
|---|---|---|
q | Quit and restore the terminal | Same |
? | Open or close the full-screen help | Same |
r | Reload the snapshot now | Reload the snapshot now |
Esc | Close help and reload | Close help and reload |
e | Expand the selected activity turn | Return to compact activity |
↑ / ↓ | Scroll recent activity | Select the newer / older turn block |
← / → | No action | Page backward / forward through complete text |
The footer also displays the automatic refresh interval. Keys are read in cbreak mode, so Enter is not required.
Colour semantics
Colour is redundant: every state also has a word, number, badge, marker, or gauge.
| Colour | Meaning in the dashboard |
|---|---|
| Yellow / amber | Pen holder, TTL gauge, elevated usage, incomplete evidence, or a disarmed advisory gate |
| Green | Healthy, idle, live, fresh, zero findings, or an armed gate |
| Red | Stale, near a provider limit, or one-or-more doctor findings |
| Cyan | Version and neutral informational values |
| Magenta | Live/next-turn relay arrow |
| Dim | Structure, unavailable data, and secondary notes |
| Inverse light badge | Literal relay state |
The renderer selects truecolour when COLORTERM is truecolor or 24bit, xterm-256 when TERM contains 256color, semantic ANSI-16 otherwise, and plain text when NO_COLOR is present or TERM=dumb. NO_COLOR changes presentation, not content or alignment.
Degradation matrix
| Environment or missing capability | Dashboard behaviour | Information retained |
|---|---|---|
| Interactive POSIX TTY, 100+ columns | Wide, tabulated alternate-screen view | Full sections and aligned semantic tracks |
| Interactive POSIX TTY, 24-99 columns | Stacked view; width is never treated as less than 24 | PEN, TTL, agents, listeners, ledger, turn, bounded activity, TIME, keys |
| Short terminal | ACTIVITY shrinks first, down to zero rows | Safety and ownership sections remain; terminal cropping is preferred to silently dropping them |
| Very tall terminal | ACTIVITY shows at most 20 events and blank-fills the remaining frame | Readability, exact frame height, and footer position |
| Terminal resize | A POSIX resize wakeup recomputes both dimensions and clamps the saved activity offset | Current help/mode and valid scroll position |
NO_COLOR or TERM=dumb | No ANSI colour escapes | All labels, badges, percentages, symbols, and frame geometry |
Non-TTY, piped output, --plain, M8SHIFT_NO_ALT_SCREEN, or native Windows | Falls back to the core scrolling watch view | Read-only status monitoring without alternate-screen or cbreak assumptions |
| Provider omits a usage window | Shows n/a | Distinction between absent data and a failed read |
| Snapshot field cannot be read | Shows unavailable or — | Honest uncertainty; no invented value |
| More recent activity exists than the bounded buffer can hold | Shows the older-history edge marker | Real turn positions and an explicit route to deeper history |
| Partial time evidence | Keeps unknown visible | Honest lower-bound classified totals and recoverable coverage detail |
Read-only and compatibility boundaries
The dashboard consumes snapshot schema major version 1 and refuses an unsupported major instead of guessing. Normal refresh uses the bounded status snapshot; expanded activity performs a point read only after an explicit e selection. Neither path claims, releases, refreshes, or writes the relay pen.
For the reviewed macOS terminal palette and capability setup, see How-to — macOS truecolour dashboard with iTerm2. The rendering contracts are recorded in RFC 059, RFC 060, RFC 061, and RFC 063.